How can retailers use this data?

By counting the number of people that are at a specific time and day in the store, retailers can optimise the number of staff on the floor, at the fitting rooms or at the cashiers, and predict the days and times, based on historical data, when the store will have more customers. This can provide efficiency/cost gains in relation to staff, one of the larger costs a retailer incurs. Moreover, it can help determine the “role” each store has: i.e. a lot of footfall but very little purchases? Is it because customers are using that store more as a showroom to interact with products rather than to actually purchase the products?, shoppers come to use the click & collect facilities rather than purchasing from the store?, the store has little footfall compared to other stores but a high purchasing rate…?

Measuring total and average time spent in store can help predict when the peak times will be in order to optimise staff in fitting rooms and cashiers, for example, as people might spend longer in store. Also, this tool can provide a deeper understanding of the physiology of shopping and understand in which stores people spend more time and in which ones less, spot trends on specific dates such as weekends, where maybe shoppers not being in a rush spend more time in average than on weekdays to give you and idea of which days to start your sales, place new collections, etc..
This can help retailers understand shopper navigation inside the stores and localise areas that are less visited by shoppers.
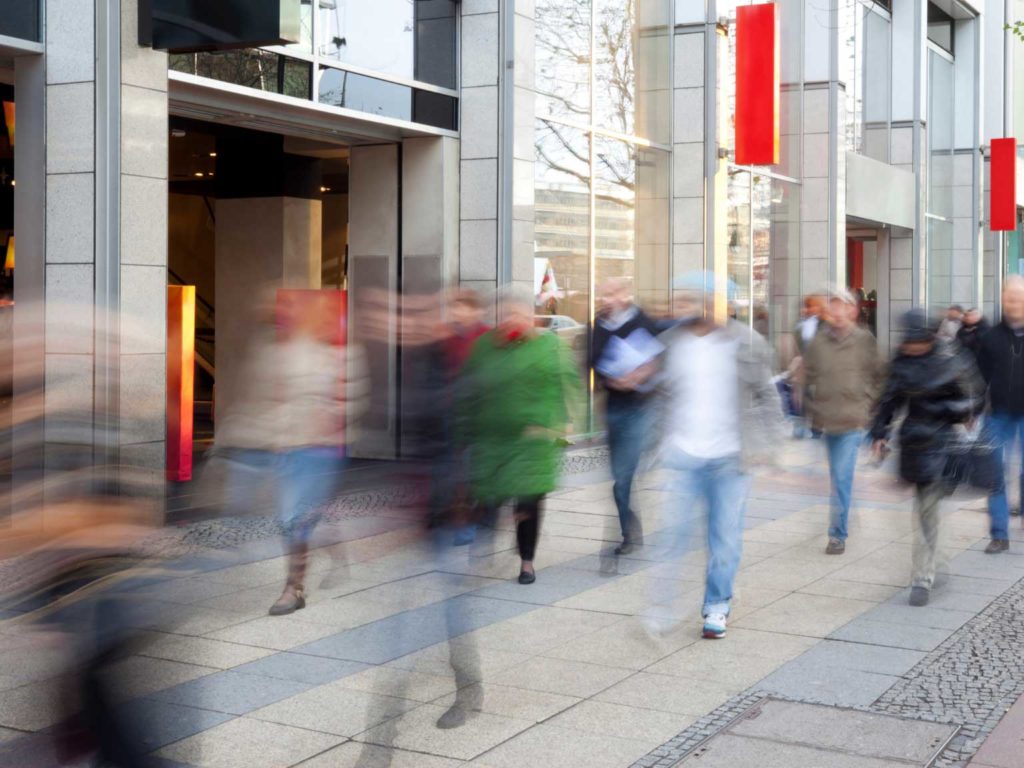
This can help understand if the ratio of by-passers that actually go into the store and become potential clients, and the actual amount of foot traffic that the area where your shop is located has, compared to other stores and areas, to potentially assess the actual exposure your stores have in every location at different times and days.

If an area is always red, whenever the retailer launches a new product or collection he should make sure to place it within that area for higher exposure, for example. Similarly, retailers can assess the navigation and layout of their store by analysing the amount of people located in different areas and A/B test product placement .
Allowing retailers to filter all the reports and data by gender and age range can provide a deeper understanding of the profile of shoppers coming to their store. If for example, a retailer sells women’s wear but sees that 25% of the footfall is male from 26 to 35 years old during the first two weeks of December, they can understand that these shoppers are quite likely buying Christmas presents for a female and this information can be used to conduct marketing campaigns targeting men while promoting women’s wear.
The retailer is able to select the islands, shelves/racks that interest them the most and measure the amount of people standing on those areas and the average time they spend engaging with the products located there. This tool can help them understand potential product demand, most popular products that can then be correlated with actual units sold, and engagement with specific collections/sets of products to understand shoppers’ likes or dislikes.
Data shown in this heat map will tell the retailer which areas are most popular based on the average amount of time people spend in those areas, meaning either they are spending more or less time in a specific area. From this data, retailers can understand if shoppers are just passing through that area on their way to another area…, or if they are actually staying to have a look at something. This tool can help retailers make decisions on store navigation and layout.
Every client uses this tool to measure different things ranging from: fitting rooms to know the amount of people that try on things and the average time spent inside to make projections of the number of fitting rooms that need to be open at specific days and times, or the amount of staff receiving clients for fitting rooms to reduce queuing times. Other clients use this tool to monitor staff rooms or stock rooms to see the average time spent in there by their staff in comparison to the opening hours. Optician/eyewear clients, for example, use this to monitor their eye testing rooms and understand how long clients stay inside while having an eye test to optimise their number of potential appointments during a day, as well as their clinicians needed on floor at specific times.
Measuring total and average time spent in store can help predict when the peak times will be in order to optimise staff in fitting rooms and cashiers, for example, as people might spend longer in store. Also, this tool can provide a deeper understanding of the physiology of shopping and understand in which stores people spend more time and in which ones less, spot trends on specific dates such as weekends, where maybe shoppers not being in a rush spend more time in average than on weekdays to give you and idea of which days to start your sales, place new collections, etc..
This can help retailers understand shopper navigation inside the stores and localise areas that are less visited by shoppers.
This information can help plan the number of staff needed at cashiers at rush hours, understand the queuing time and make decisions on how to reduce it to decrease cart abandonment.
The summary report will provide information for future peak times and retailers can prepare their staff
Benefits of TrackIn
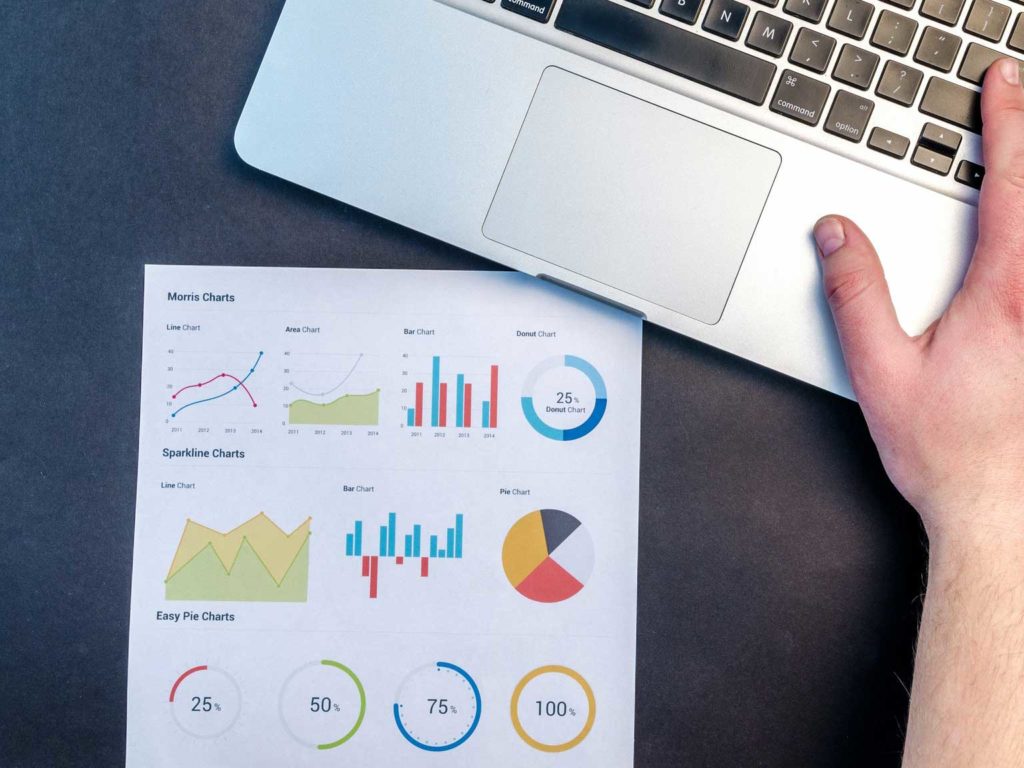
Video Analytics at
a business level
By recognizing specific patterns, and then analysing those patterns and behaviours (“why did this pattern occur?” “will it happen again?” “what do we need to change in order to optimise performance?”), retailers can determine what actions need to be taken in order to decrease costs and increase revenue. This information can be vital to a company’s financial planning, employee evaluations, marketing efforts and overall business performance.
Marketing Efficiency and effectiveness
Understanding customer needs and wants takes marketing analysis beyond just knowing marketing spend and how much ROI you get from those investments. The use of analytics allows companies to know which marketing channels bring the highest-value customers in terms of order size, retention rate and profitability; ultimately, this helps to cut marketing costs and expand customer reach more efficiently.

Increased Sales
Understanding customer purchase decisions and behaviours when visiting the store is key to increasing sales. Customer analytics are used to identify factors that have both a positive and negative impact on sales. This could include customer service, product availability in store, product display, store layout, queuing times, etc.
Benchmarking stores’ performance
Retailers can calculate and compare foot traffic and conversion rates for all stores by identifying trends and isolating conversion triggers in store. Retailers are able to highlight the highest and lowest performing stores and act on staff training, extended opening hours, product display, store layout and even on store location.
Customer Acquisition
When investing on acquiring customers, customer analytics can help measure the impact on conversion rates and traffic when conducting a marketing campaign or when using specific marketing channels. DataMatics (McKinsey DataMatics Survey, 2013) states that companies tracking marketing acquisition KPIs are 23 times more likely to outperform their competitors in this area.
Store layout, and product display migration to profitable segments
Sometimes businesses offer product ranges where the lower ranges may have lower margins or even be unprofitable. The goal should be to move customers to a higher range or pursue a higher spending amount. This can be achieved by providing an enjoyable and seamless shopping experience when visiting the stores to increase the time spent, A/B testing product demand and/or stock depending on the type of customer profile visiting the store, etc. Companies measuring and acting on this are 21 times more likely to report as outperforming on migrating and targeting efficiently more profitable segments (McKinsey DataMatics Survey, 2013).
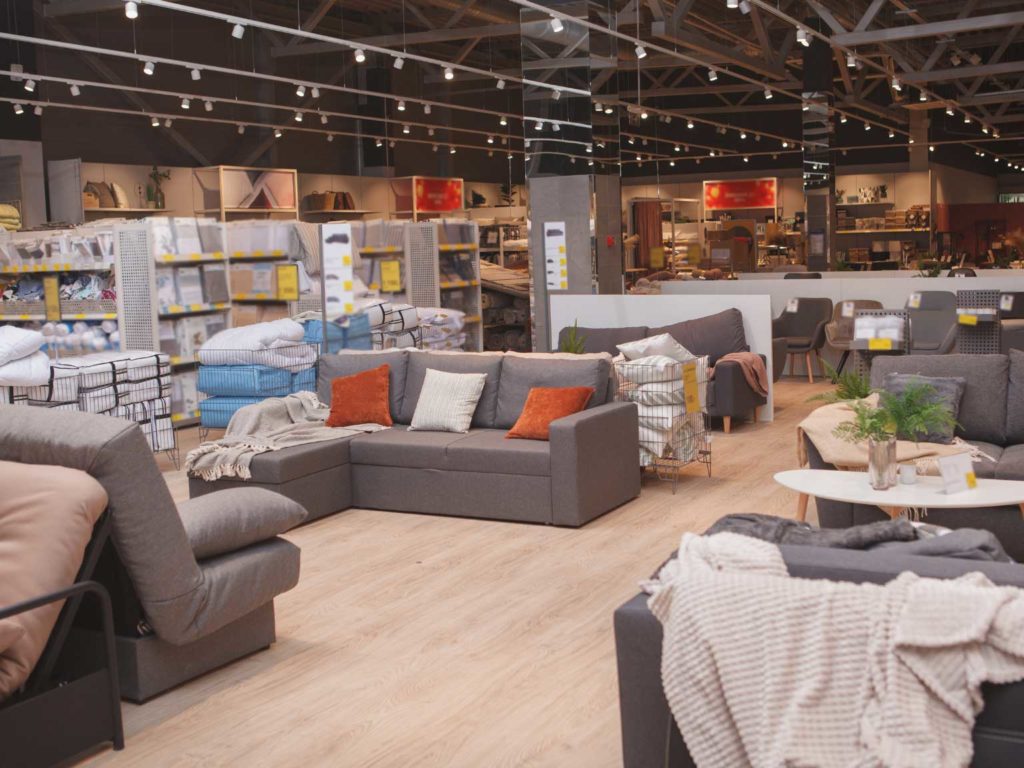
Engagement in store
Measuring customer behaviour can help increase product and brand engagement in store by understanding if the product display and location drives more attention from customers, if the store layout is easy to navigate and allows customers to find what they are looking for more easily, and it can indicate which areas and products are more popular among customers based not only on conversions but on dwell analysis and heat maps.
Get it touch
- +44 7490698974
- 250 Marylebone road. London, United Kingdom
Subscribe to our newsletter
The only reason we will ever send anything is
to share important updates about Seque.
Garo Solutions ltd. registered in England and Wales. Company number 11567453 – Copyright @ 2022 Garo Solutions ltd all rights reserved.